
Eskwelabs Event Performance Dashboard
An automated Looker Studio dashboard that brought four years of event data (80+ events, 1,000+ attendees) into one view.
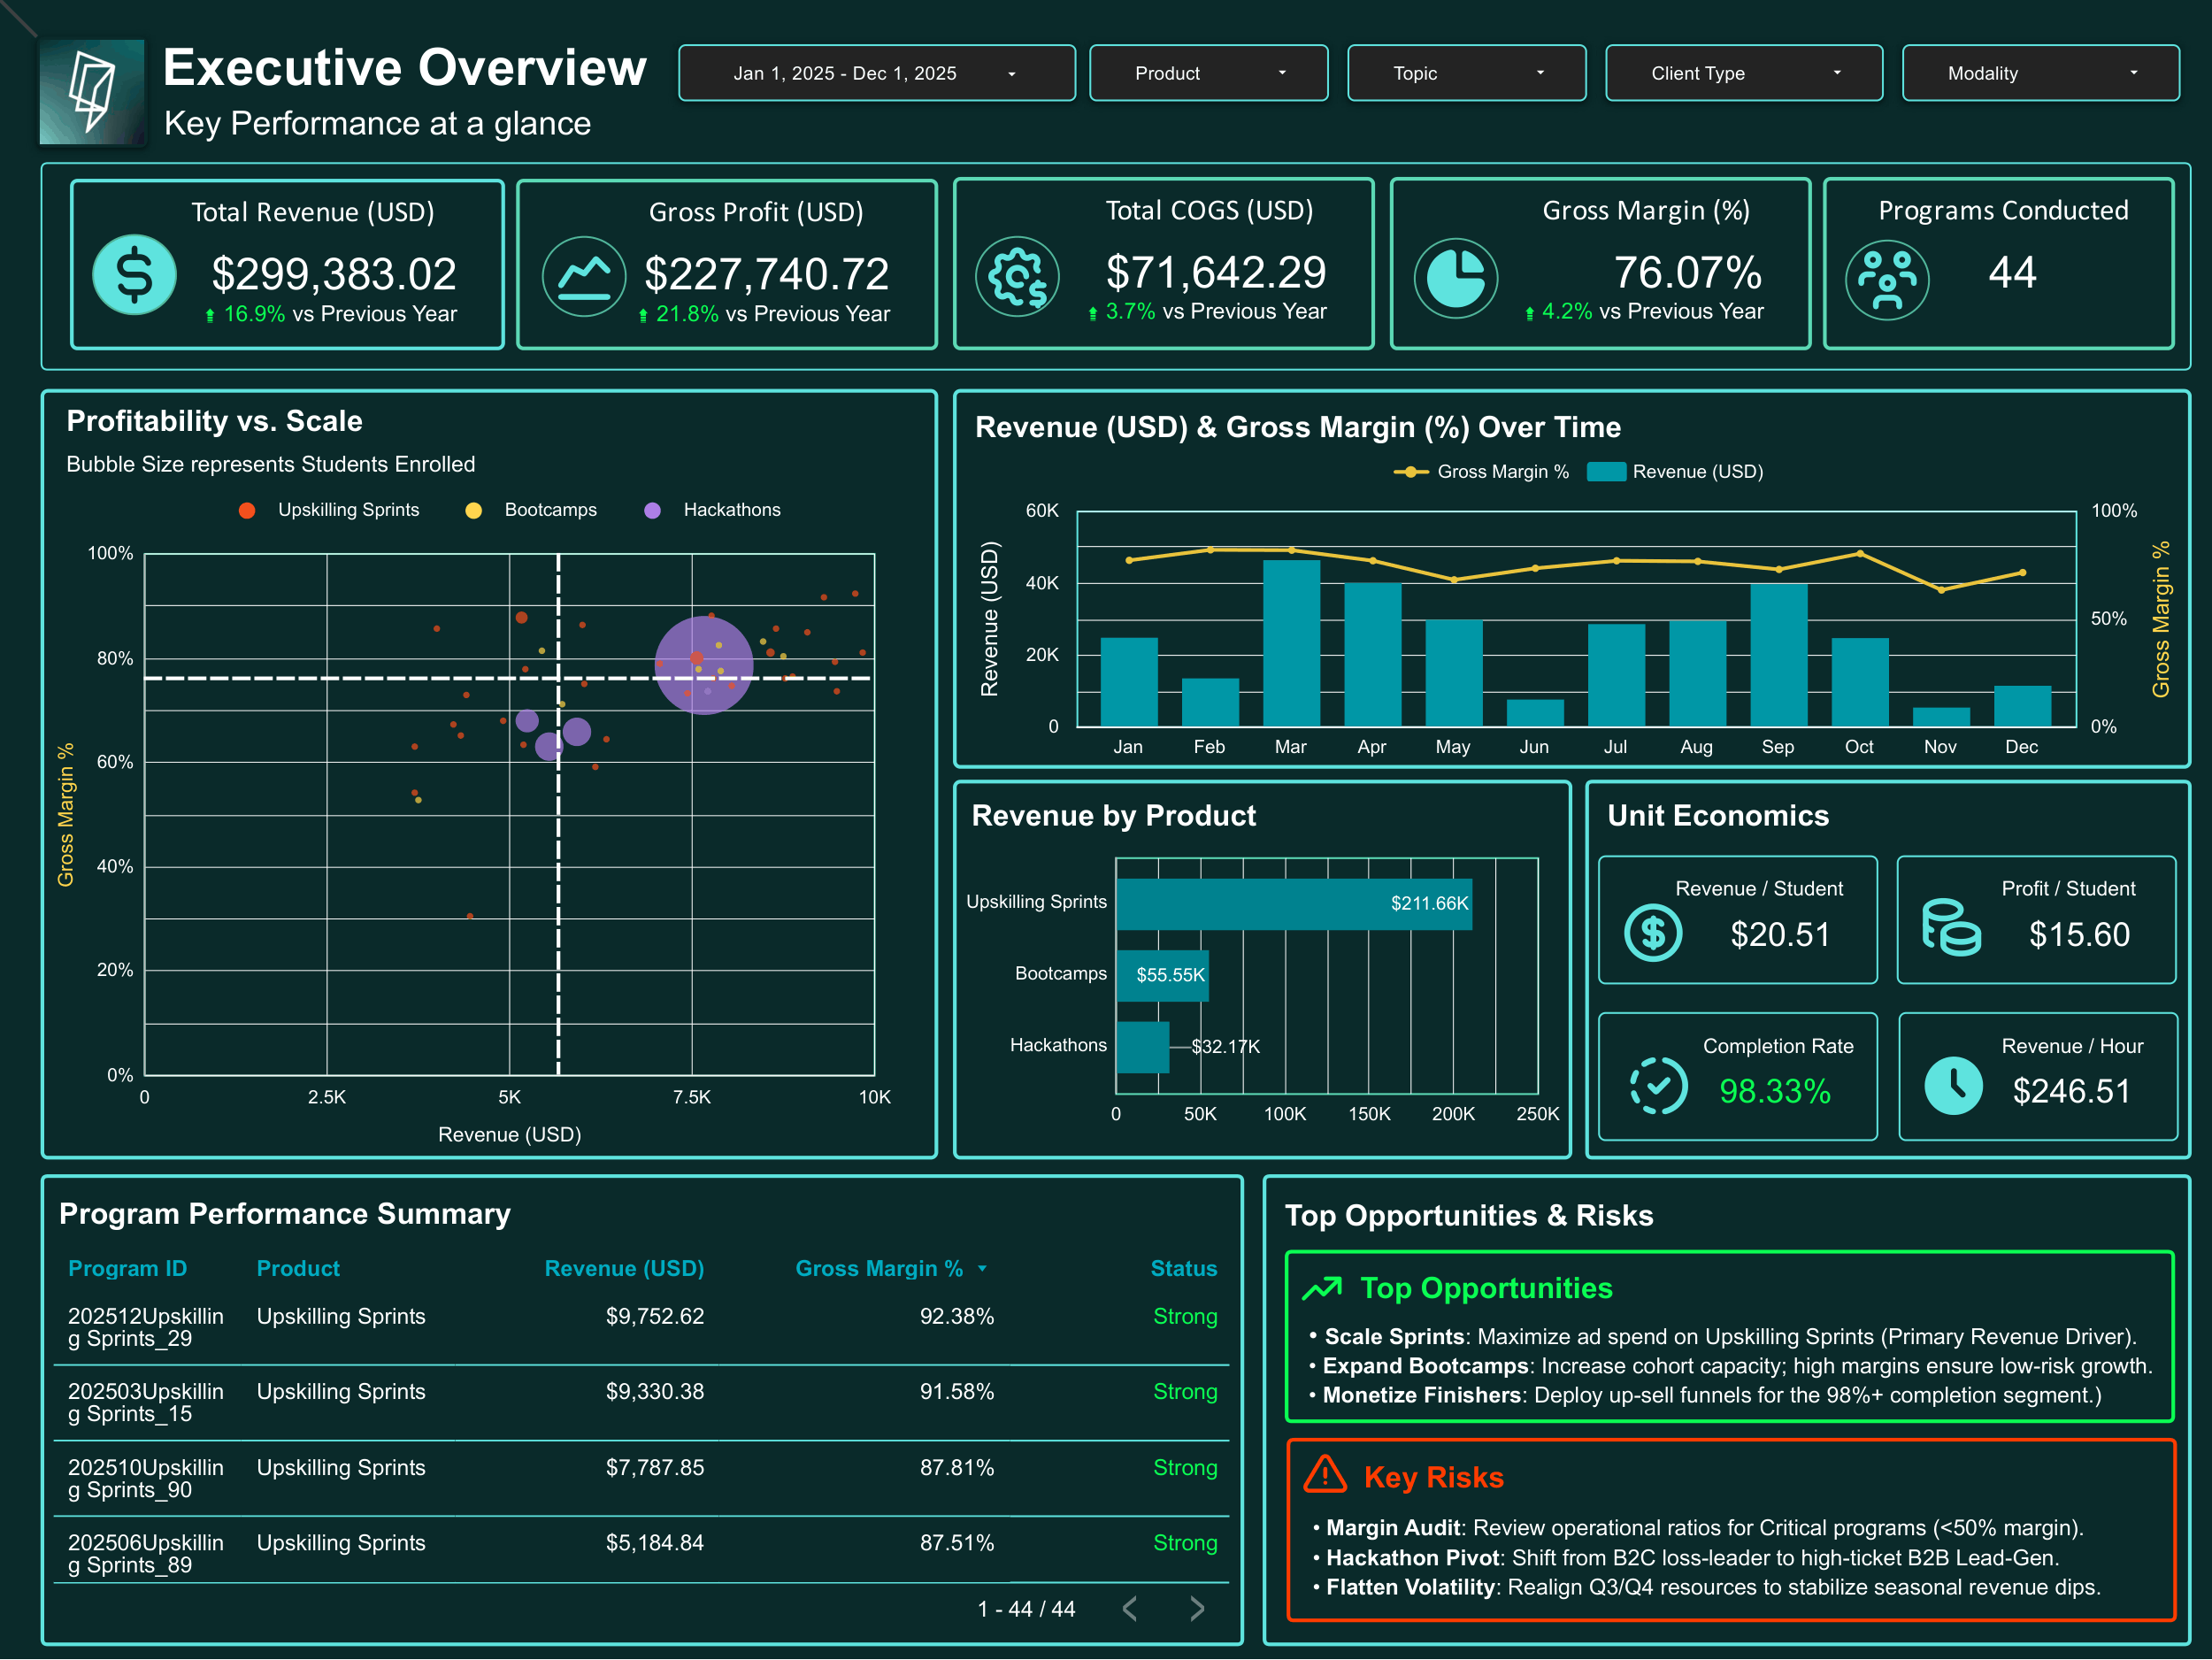
Data Analytics Internship at Eskwelabs, February to May 2026.
The problem
Event results were spread across four years of records and reported by hand, so there was no single place for stakeholders to evaluate revenue.
What I built
- An automated Looker Studio dashboard consolidating 80+ events and 1,000+ attendees into one view
- Masked datasets to protect sensitive information while testing the pipeline logic before launch
Result
Manual reporting was replaced with a dashboard stakeholders can open any time to evaluate event revenue.