
From Raw Data to Cloud Insights
- Date
- Organizer
- AWS Student Builder Group PUP
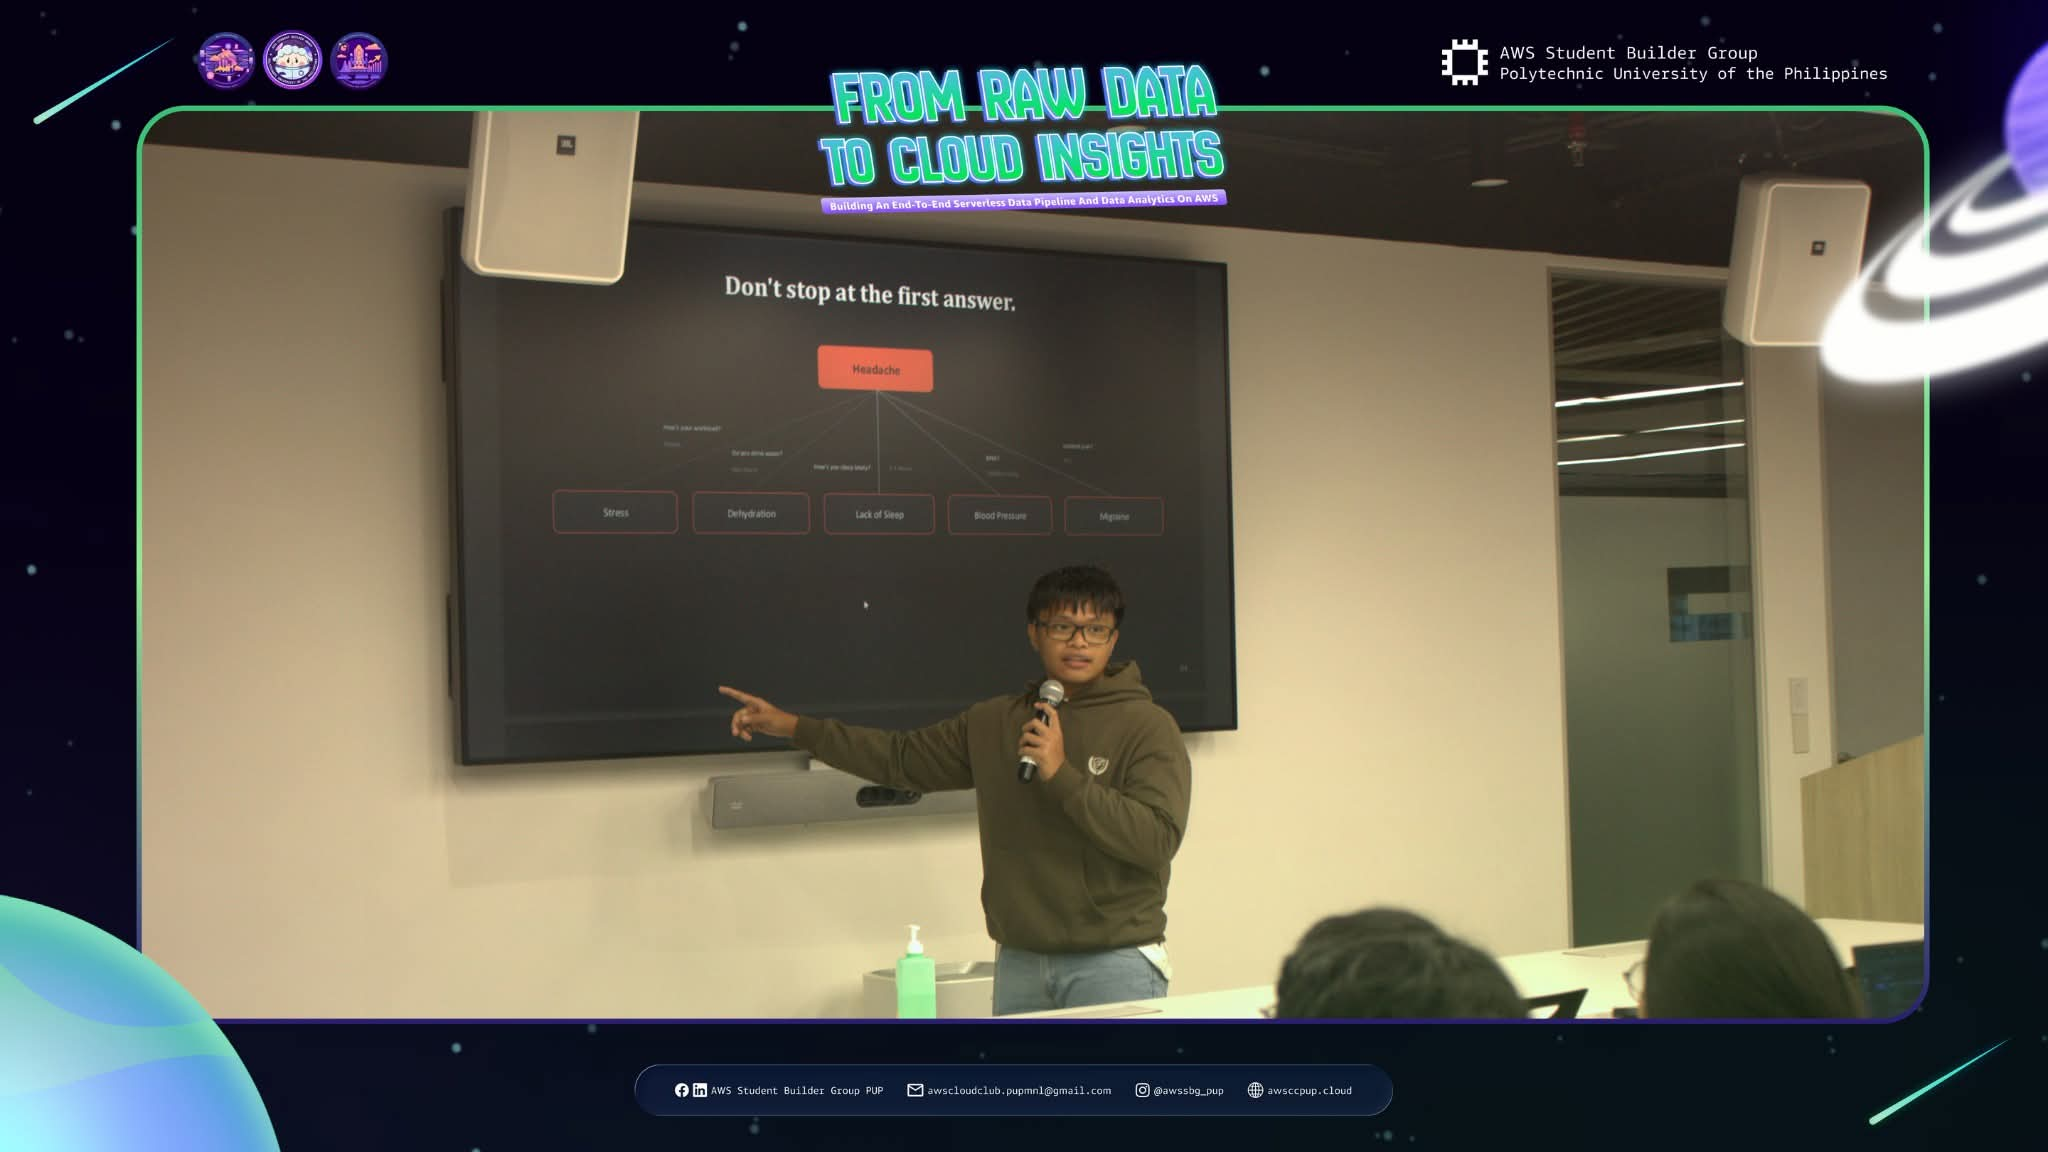
Most tutorials show one tool at a time. In this workshop I wanted members to see the whole journey: how a raw file becomes a dashboard someone can actually read.
We followed the data through the cloud. It landed in S3, where Lambda picked it up and processed it. EventBridge kept each step running on its own, and Redshift stored the data so we could query it. At the end, Looker Studio turned it all into charts. Seeing the pieces connect is what turns a list of AWS services into a working data pipeline.
But a pipeline is only half the job, so I closed with dashboard design. I taught the Z-scan, the Z-shaped path our eyes follow across a screen, so the most important numbers sit where people look first. Then I compared a good dashboard to a doctor: a doctor checks the symptoms, finds the cause, then decides on treatment, and a dashboard should guide its reader the same way, from what’s happening, to why, to what to do next.